Businesses are inundated with information from various sources, making data visualization more critical than ever before. Effective data visualization not only simplifies complex data but also empowers decision-makers to extract actionable insights. Keeping up with the latest trends in data visualization is essential for organizations looking to stay competitive and make informed choices.
The Evolving Landscape of Data Visualization
Data visualization has come a long way from basic pie charts and bar graphs. With the advent of technology and an explosion of data sources, the field has evolved dramatically. Organizations now have access to a wide range of visualization techniques, tools, and platforms to help them make sense of their data.
The Impact of Big Data
The proliferation of big data has revolutionized data visualization. Traditional tools struggle to handle the massive volumes of data generated daily. As a result, businesses are adopting advanced visualization solutions that can process and display big data efficiently.

Interactive and Real-time Visualizations
Static charts and graphs are giving way to interactive and real-time visualizations. Decision-makers can now explore data dynamically, drilling down into specific details and gaining insights in real-time. This trend is transforming decision-making processes across industries.
Storytelling with Data
Data storytelling is gaining traction as a powerful communication tool. Instead of presenting raw data, organizations are crafting narratives around their data, making it easier for stakeholders to understand complex trends and patterns.
Artificial Intelligence in Data Visualization
AI is playing a significant role in data visualization. Machine learning algorithms can analyze data and recommend the most effective visualization techniques, simplifying the process for users. AI-driven tools also help uncover hidden insights within data.

Customization and Personalization
Businesses are demanding more customizable and personalized data visualization solutions. They want to tailor visualizations to their specific needs, ensuring that data insights align with their unique goals and objectives.
The Role of Dashboards
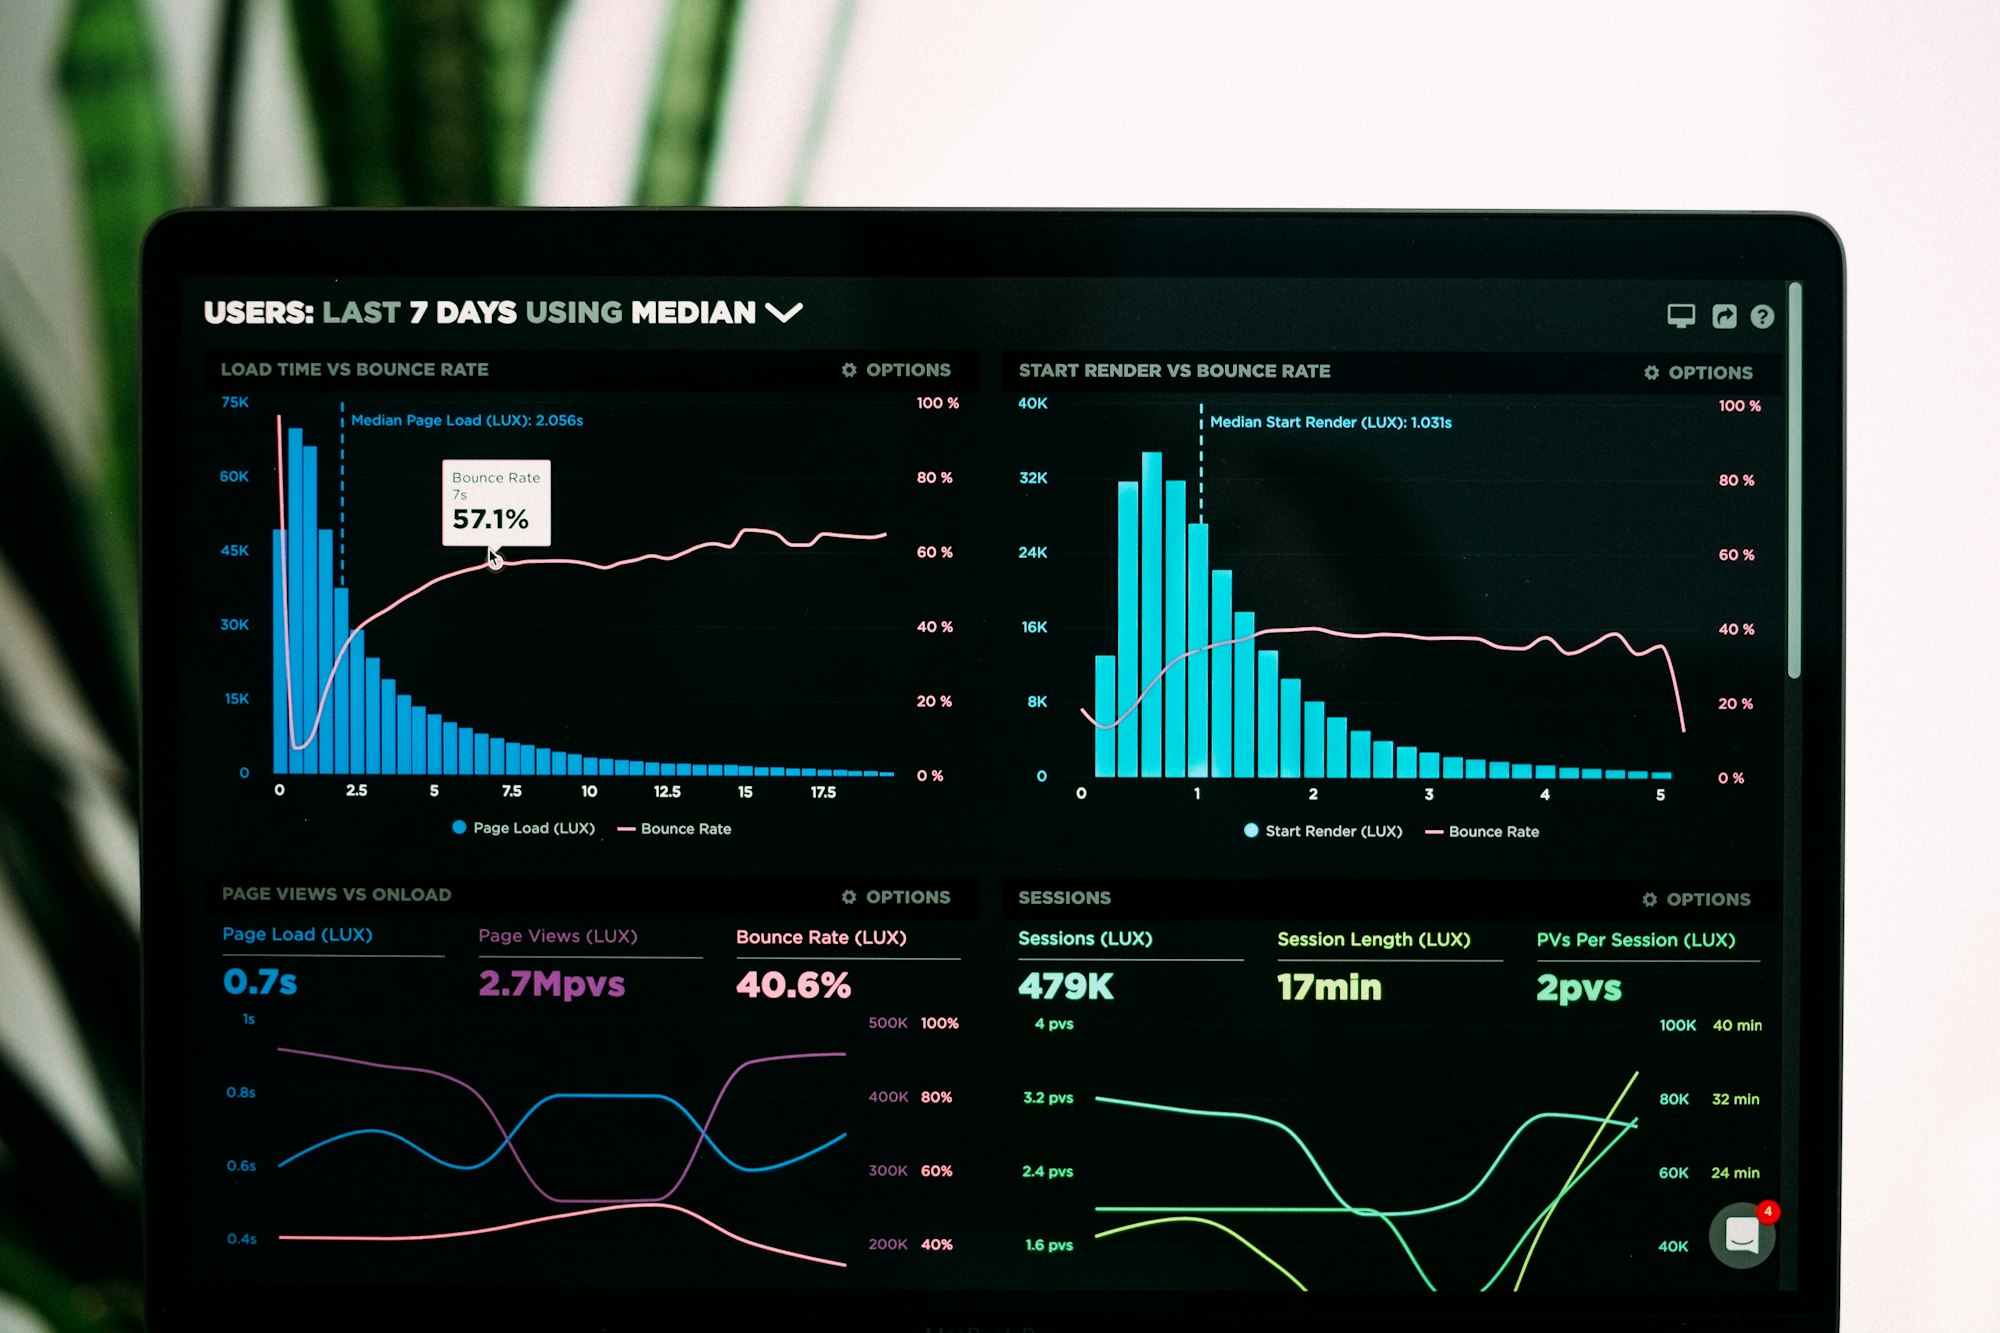
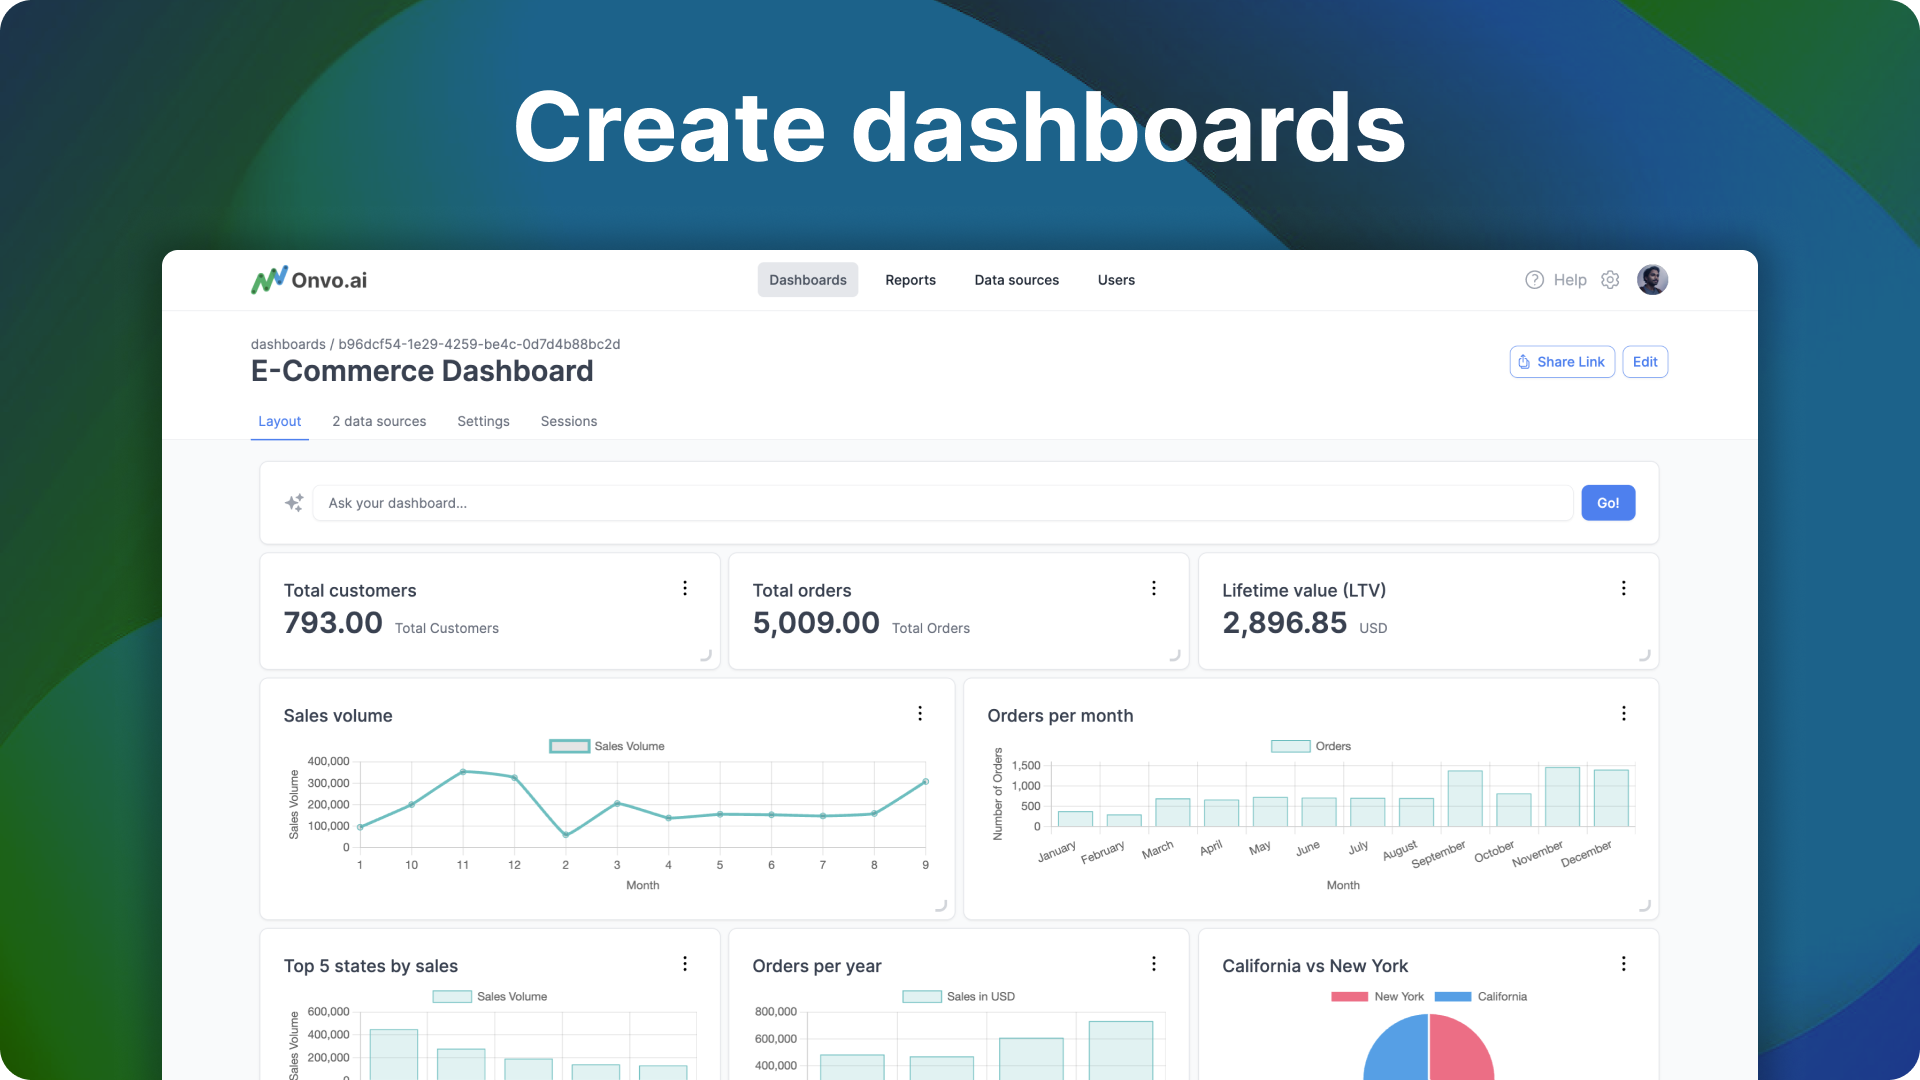
Interactive dashboards are becoming indispensable for decision-makers. These dashboards provide a centralized view of key metrics and KPIs, allowing users to monitor performance and identify trends at a glance.

The Challenges of Data Privacy
As data privacy concerns grow, organizations must consider how they visualize sensitive information. Data visualization techniques that can anonymize and protect personal data are becoming essential.
Data Visualization for Predictive Analytics
Data visualization is no longer limited to historical data. Businesses are using visualization to understand and communicate predictions and forecasts, helping them plan for the future more effectively.
Augmented and Virtual Reality
Emerging technologies like augmented reality (AR) and virtual reality (VR) are entering the data visualization space. These immersive experiences enable users to interact with data in entirely new ways.

The Importance of Data Literacy
With advanced data visualization tools at their disposal, organizations are investing in data literacy programs to ensure that employees can interpret and use data effectively.
Choosing the Right Data Visualization Tools
Selecting the appropriate data visualization tools is crucial. Organizations must consider factors like scalability, ease of use, and compatibility with their existing systems. Cloud-based solutions are also gaining popularity due to their flexibility and accessibility.

Data visualization continues to evolve rapidly, driven by advancements in technology and the growing importance of data-driven decision-making. Staying informed about the latest trends and technologies in data visualization is essential for organizations looking to harness the full potential of their data and gain a competitive edge in today's data-centric business landscape.
Ready to Dive In?
If you're intrigued by the possibilities of AI-powered data visualization, we invite you to explore further. Visit our website for more information or book a call with us to discover how Onvo can revolutionize your data-driven decision-making.
