Data is continuously generated at staggering rates in today's business landscapes. From customer interactions to sales metrics, the volume of data can be overwhelming. That's where data reporting comes in, transforming raw data into actionable insights that drive informed decision-making for managers, CEOs, customers, and clients alike. Let's explore the essence of Data Reporting.
What is Data reporting?
Data Reporting is the process of extracting data from diverse sources, refining it into easily digestible formats, and presenting it in the form of comprehensive reports. It involves transforming raw data into actionable insights presented in a comprehensible format. It caters to various stakeholders, from managers and executives to investors and clients, providing them with valuable information for decision-making.

Why is Data Reporting Crucial for Businesses?
Data reporting serves multiple purposes, all contributing to informed decision-making, performance monitoring, trend identification, accountability, regulatory compliance, and gaining a competitive edge. By analyzing and visualizing data, businesses can track performance, spot trends, and make strategic decisions to drive growth.
Best Practices for Effective Data Reporting
Elevate your Data Reporting practices with these actionable tips:
- Audience-Centric Approach: Tailor reports to the specific needs and preferences of your audience for maximum relevance and engagement.
- Strategic Goal Setting: Define clear objectives and goals for your reports to drive meaningful insights and actions.
- Optimal Tool Selection: Choose reporting and visualization tools that align with your objectives and audience preferences to ensure efficiency and effectiveness.
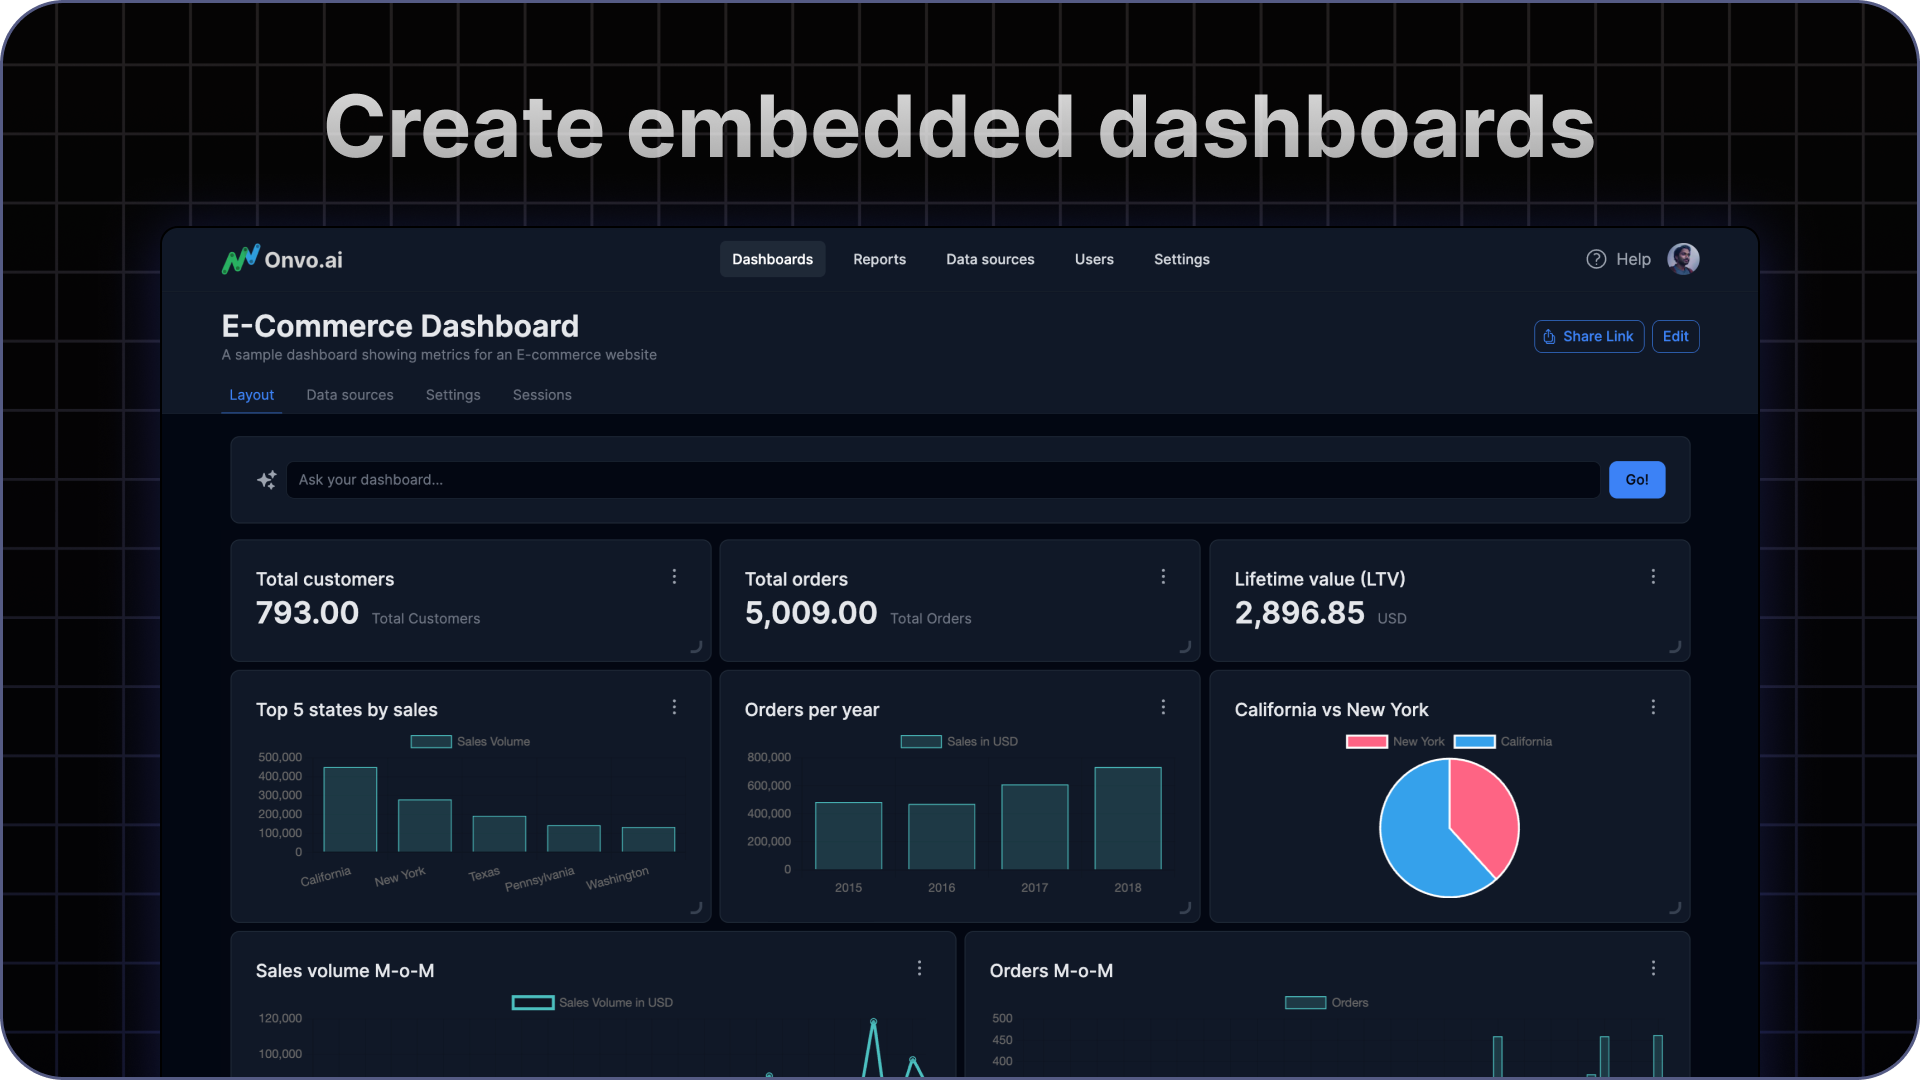
- Visual Data Representation: Utilize visualizations such as charts, graphs, and dashboards to enhance data comprehension and interpretation.
- Contextual Insights: Provide context and interpretation for data points to aid understanding and decision-making.
- Logical Report Structure: Present information in a logical and structured manner, prioritizing key insights and findings.

Data Reporting at ONVO AI
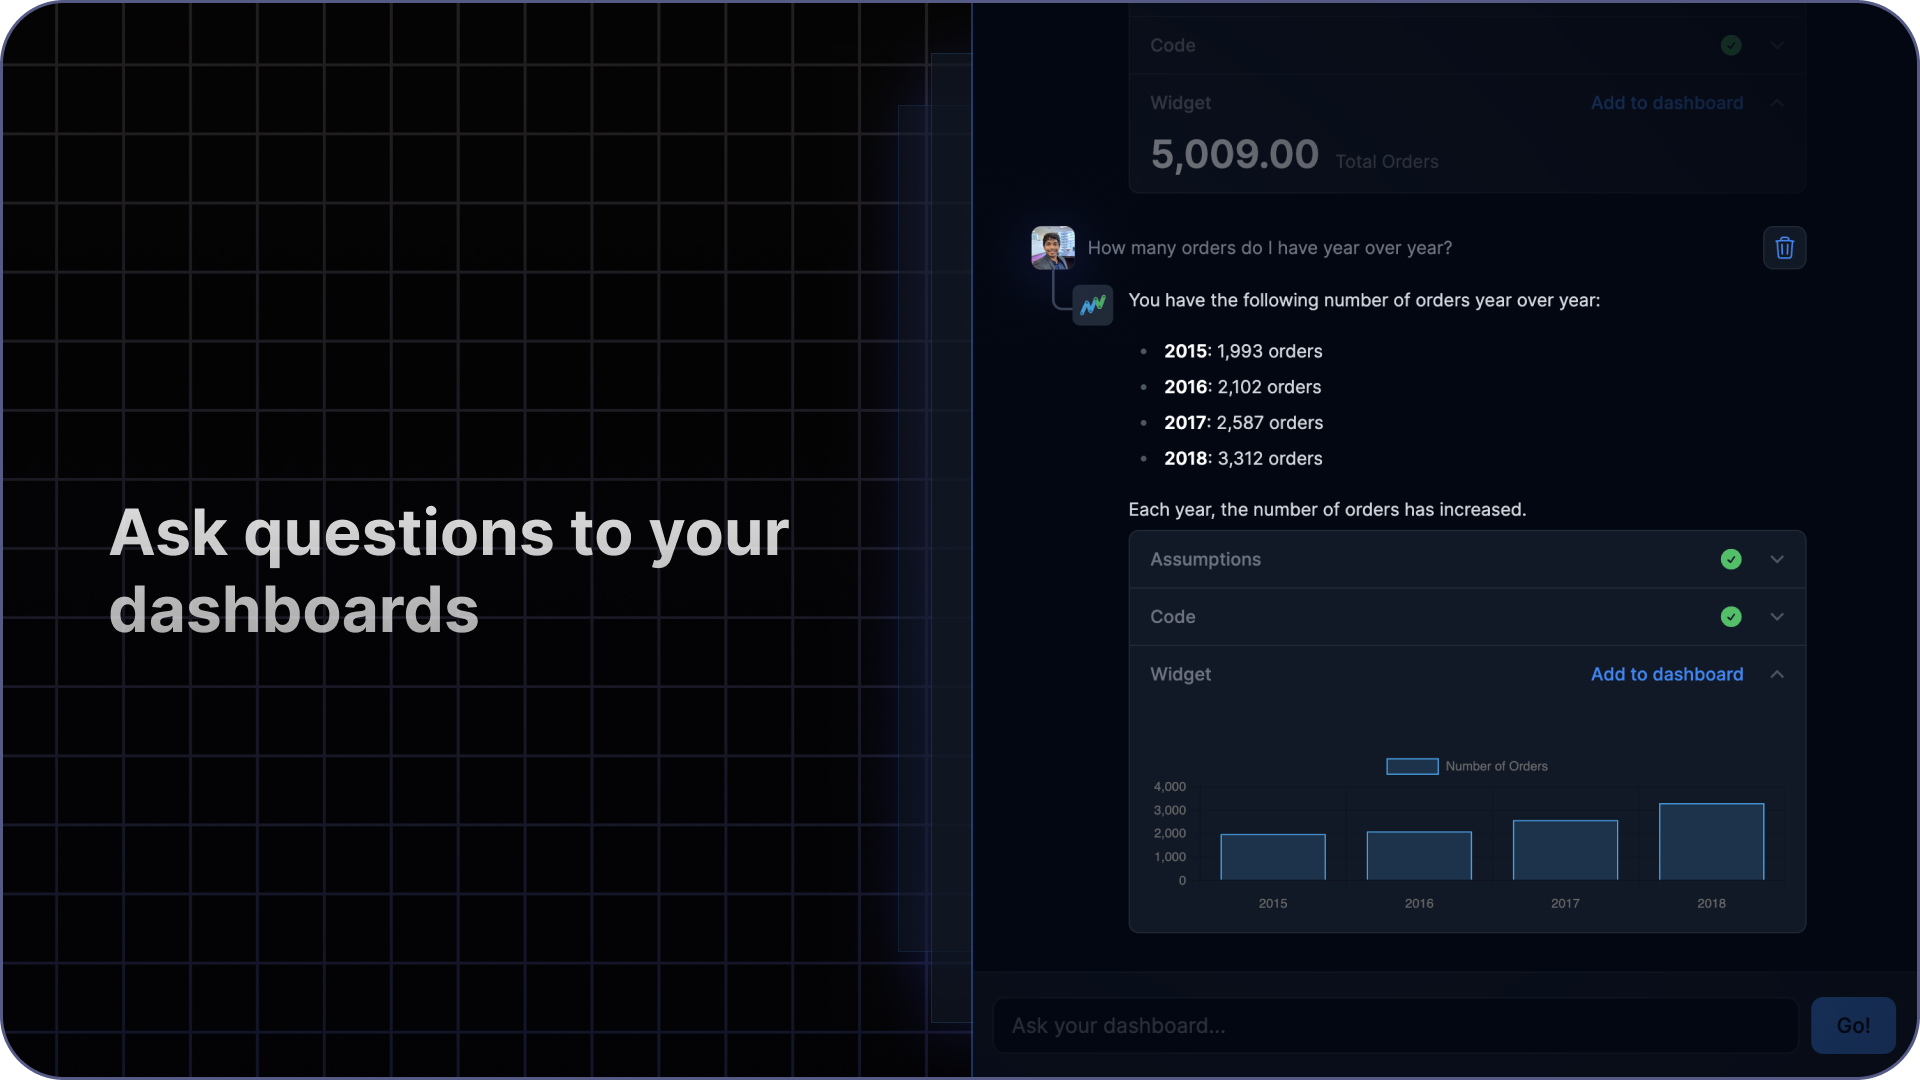
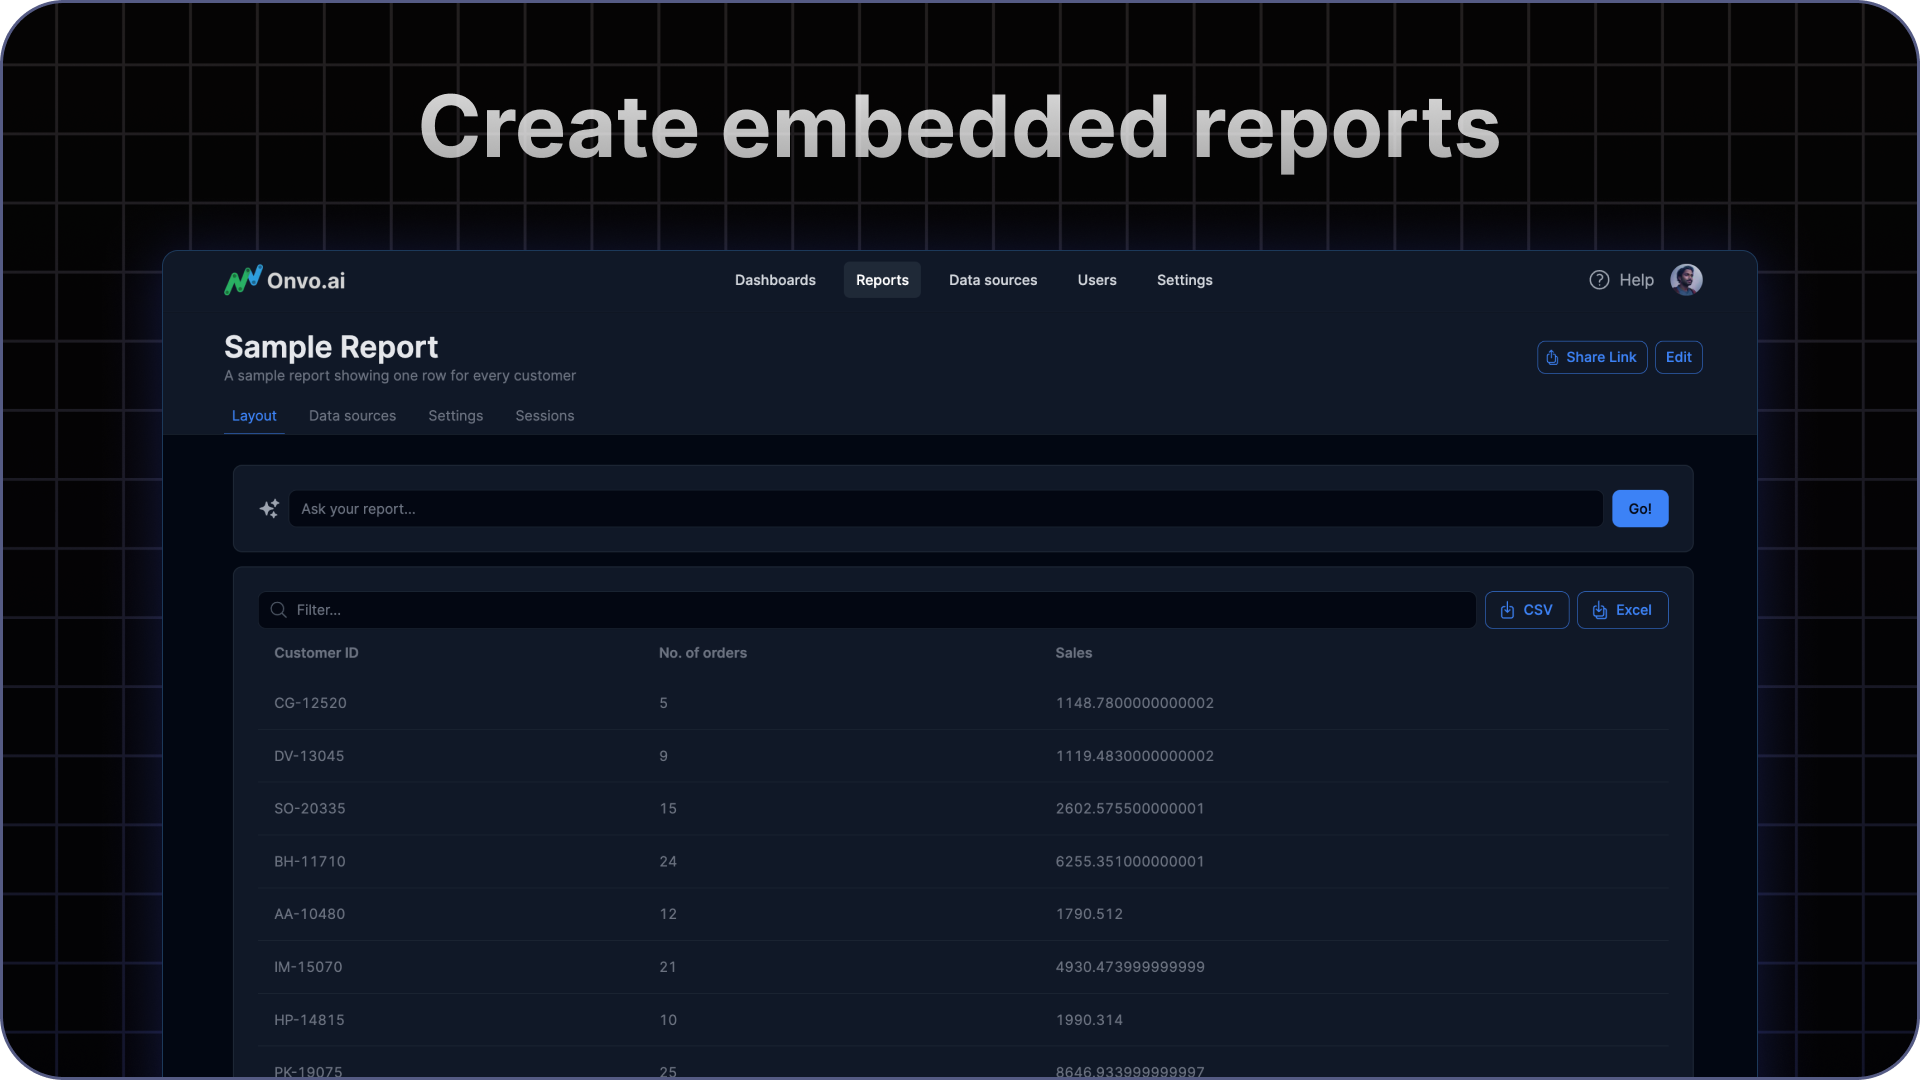
At ONVO AI, we understand the importance of data reporting in driving business success. Our platform empowers businesses to harness the power of data through advanced reporting and analytics capabilities. From customizable dashboards to insightful visualizations, ONVO AI enables users to derive actionable insights and make informed decisions.

Get in touch with our team to discover how ONVO AI can revolutionize your data reporting process and unlock new opportunities for your business!
