This is the third in a series of posts about integrating dashboards and reports into your product
When using an iframe
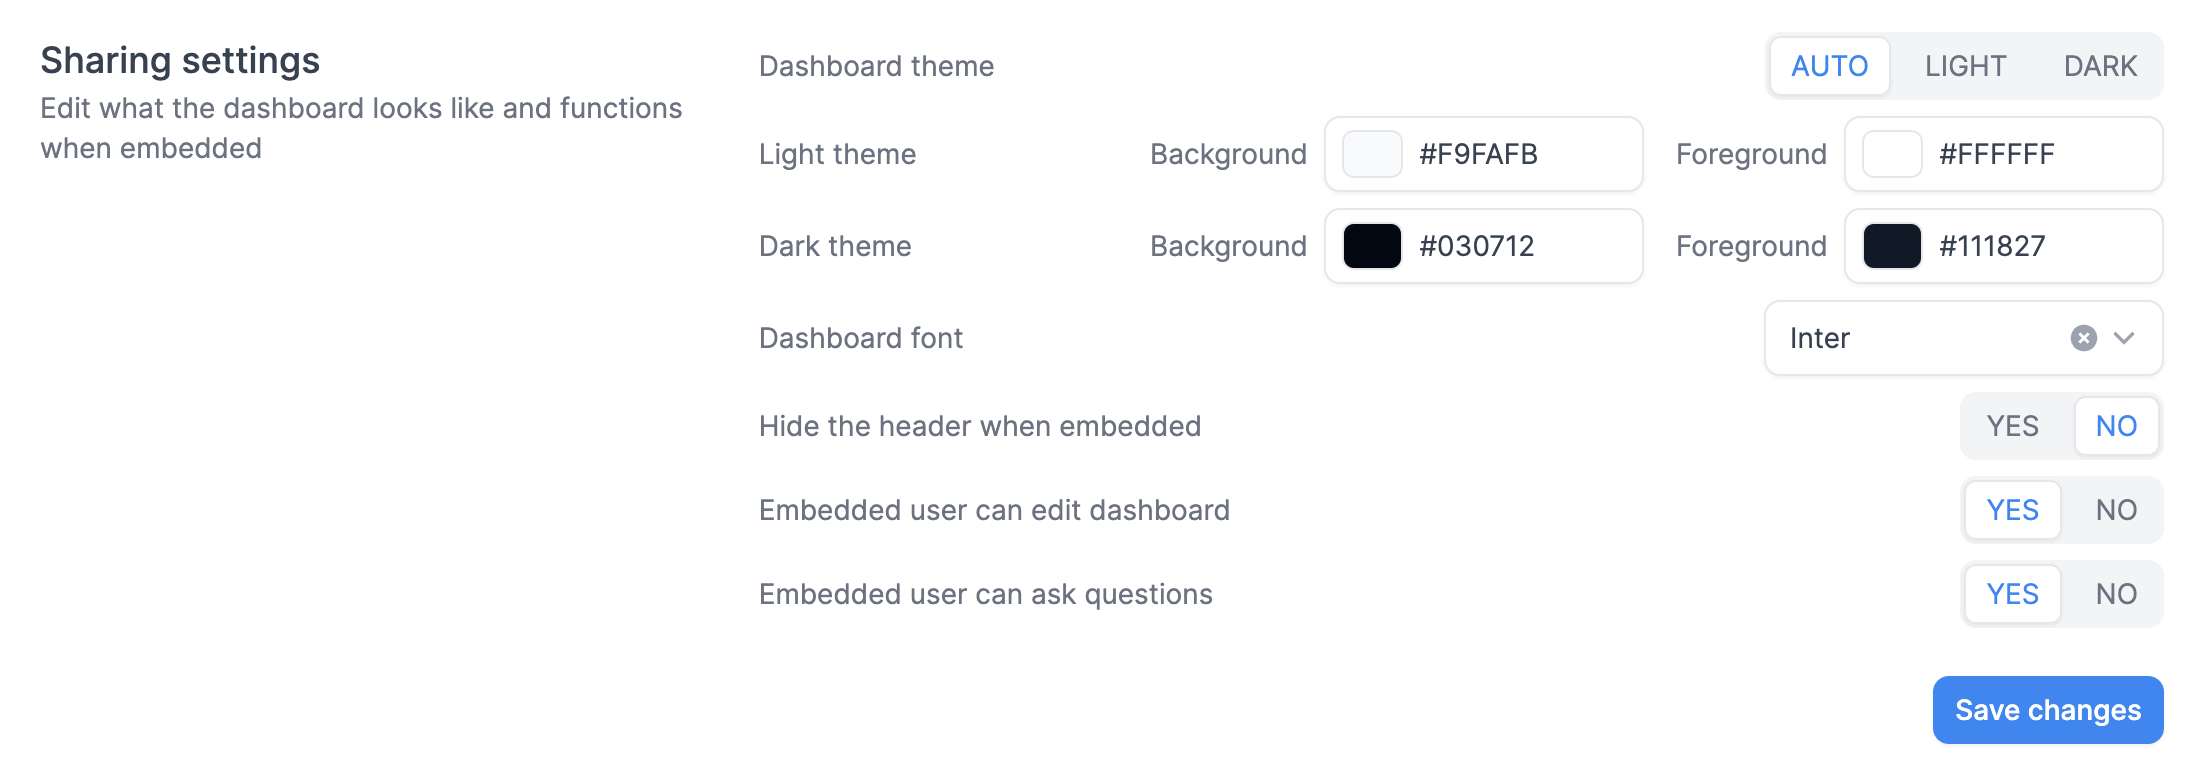
If you embed dashboards using the iframe method, you can make changes to the UI by heading over to https://dashboard.onvo.ai/dashboards/:dashboard-id/settings. Here you will find multiple options to customise.

Dashboard theme: This lets you set if you want the dashboard to adapt to the user's computers preference, or to lock it to light / dark theme.
Dashboard font: This lets you set the font for all elements in the dashboard.
Hide the header when embedded: This lets you hide the header so that you can use exiting UI in your product instead of the built in header.
Embedded user can edit dashboard: This allows users to resize, delete and move around widgets on the dashboard
Embedded user can ask questions: This allows users to ask questions to the dashboard and add widgets
When using the react library
If you are using the react library, you have a few options to customise the interface in the library.
<DashboardList variant="list|grid"></DashboardList>

<Dashboard editable={false|true}>
    <DashboardHeader />
    <DashboardGrid columns={12} spacing={4} />
    <DashboardQuestions />
</Dashboard>
In addition, you also have endless customizability by changing the styles using css.
.onvo-dashboard {
  font-family: "Avenir", san-serif;
}

.onvo-dashboard-widget {
  border-radius: 8px;
  border: 1px solid #ff0000;
  padding: 8px 4px;
}